
We analyzed a large sample size of 75,000+ shipments from the last 5 years of car shipping logs (2020 to 2025) which revealed a distinct seasonal rhythm in the US auto transport market. Our records show that June stands as the busiest peak with 11.4% of annual shipments, while the volume drops to its lowest in February at just 6.2%. We observed that weather and school schedules are the primary drivers of these shifts, with the second quarter handling a dominant 30.6% of all vehicle moves.
Our data suggests a predictable seasonal transport cycle where warmer months represent the majority of shipping activity. We also noticed that specific demographics, like “snowbirds,” create unique winter surges on southern routes. Let’s break down the movement of cars nationwide and look at the patterns we’ve observed.
Core Seasonal Vehicle Shipping Trends
Our data shows how car shipping demands shift every single month. We studied the current weather and people’s job schedules to analyze the data properly. We observed that during the warm months the demand stays high, but winter shows lower shipping order.
We concluded that most customers avoid shipping cars during heavy holiday seasons as well. All in all, the industry follows these seasonal vehicle shipping trends closely each year.
Car Shipping Demand by Month:
We noted that June is the busiest month with over 11.4% shipments, followed by May having 10.7% vehicle shipments. We observed that spring and summer months are peak vehicle shipping seasons.
But, February showed the lowest car shipping demand. It had around 6.2% car shipments, followed by September with only 6.4% vehicle orders.
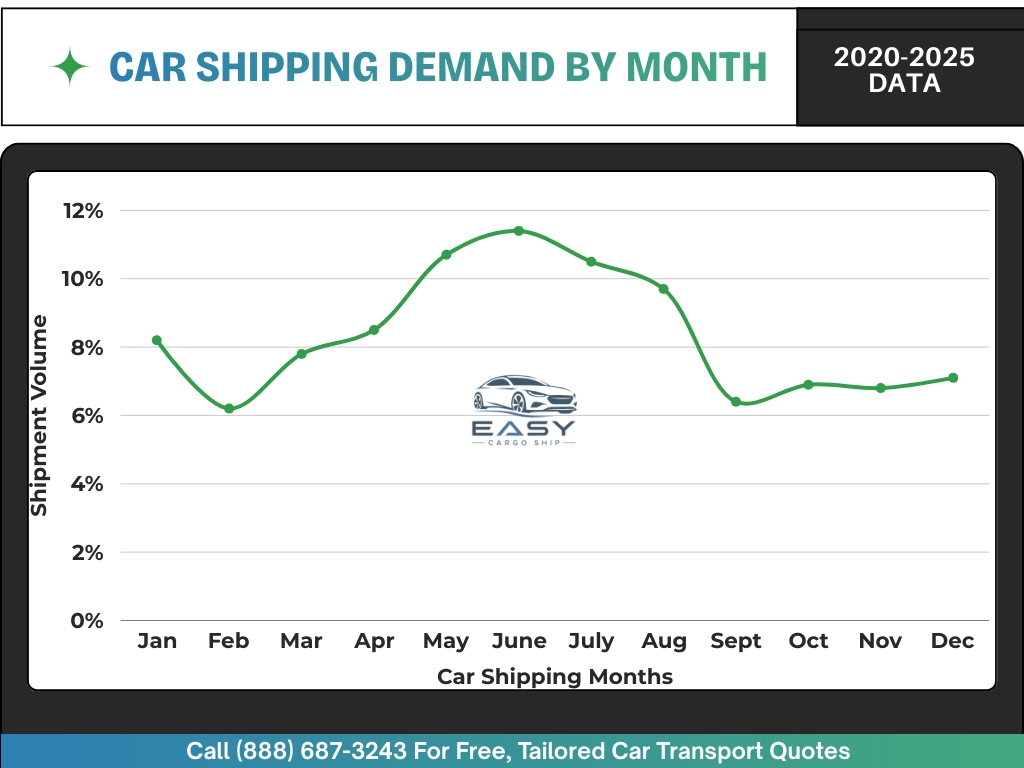
Furthermore, we noticed that the cold weather makes loading and hauling cars on trailers very difficult, which is why people wait for spring for car moves and purchases.
The spring surge begins from March when the vehicle shipping volume reaches 7.8%. Moreover, besides June, January is also a preferred month for people to move vehicles with 8.2% shipments.
| Month Name | Percentage Share |
|---|---|
| January | 8.2% |
| February | 6.2% |
| March | 7.8% |
| April | 8.5% |
| May | 10.7% |
| June | 11.4% |
| July | 10.5% |
| August | 9.7% |
| September | 6.4% |
| October | 6.9% |
| November | 6.8% |
| December | 7.1% |
Quarterly Car Shipping Trends and Behaviors
We noted that the second quarter had the most shipping activity. Our data showed that from April to June, there were 30.6% shipments. Whereas, the third quarter had 26.5% shipments, followed by the first quarter, saw 22.2% shipments. However, we recorded only 20.7% shipments in the fourth quarter.
Our data showed that summer quarters are the most profitable time for drivers and winters are considered a bit dangerous due to snow. Our data highlighted the predictability of auto transport yearly trends and seasonal car transport patterns as well.
- Q2 (April to June) 30.6% shipments
- Q3 (July to September) 26.5% shipments
- Q1 (January to March) 22.2% shipments
- Q4 (October to December) 20.7% shipments
Our data also highlighted the importance of the spring market. It showed that most people search for car shipping in late March, leading to massive shipping volume in April. This momentum keeps on going till August until Labor Day starts to cool down the demands.
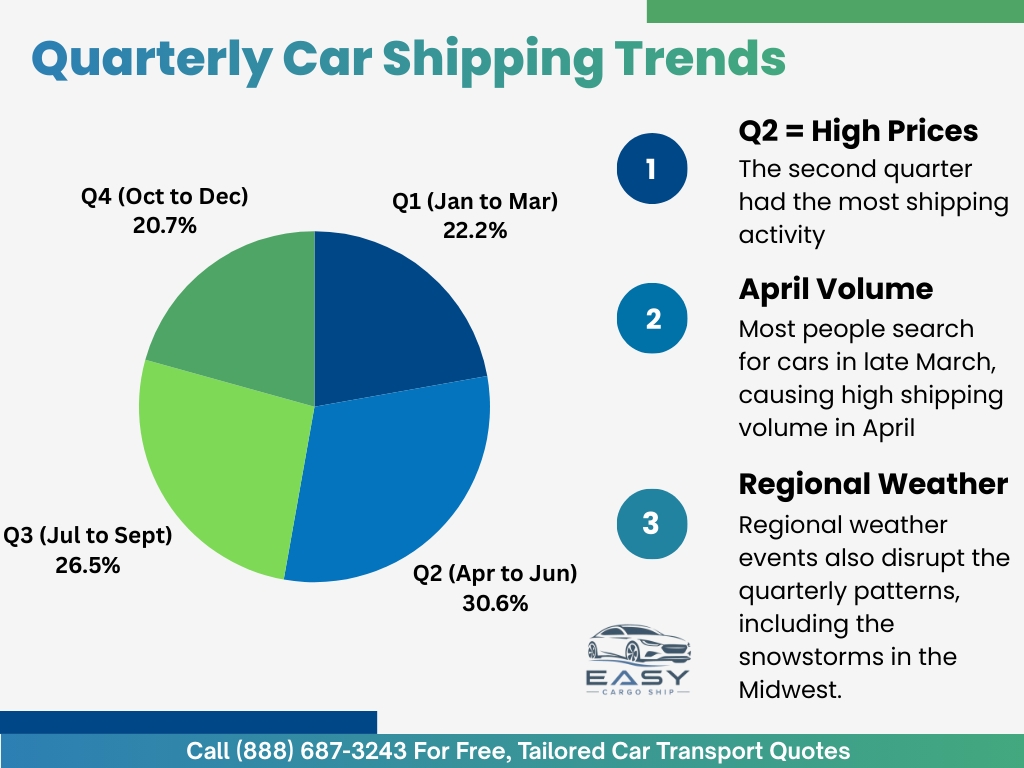
We noted that regional weather events also disrupt the quarterly patterns, including the snowstorms in the Midwest.
Geographic Seasonal Shifts
We found that shipping hubs change on the basis of local weather. People avoid moving cars due to snow or they migrate because of the snow in the north like snowbirds, which is why Southern states get more cars during winters.
We observed the surge in the northern states during late spring, probably because of the snowbirds heading back home. Our data showed that seasonal movers follow the sun for better road conditions.
Snowbird Migration & Car Shipping Patterns (October to January)
We observed that snowbirds move thousands of cars during winters, around 5.7% of each season’s shipments on average. Our data from October to January across all five years helped us identify this pattern.
Our shipments were in between October and December and the group includes vehicle owners from New York and Massachusetts. Our data showed that we shipped many cars from New Jersey, Pennsylvania, Connecticut, and Ohio.
However, we observed a restraint amongst Illinois, Michigan, Minnesota, and Wisconsin residents due to heavy snow.
We also noticed that January represented a 25.0% increase to Florida routes. Consequently, we noted that the ten states’ car shipments to Florida total averaged 17.4% annually.
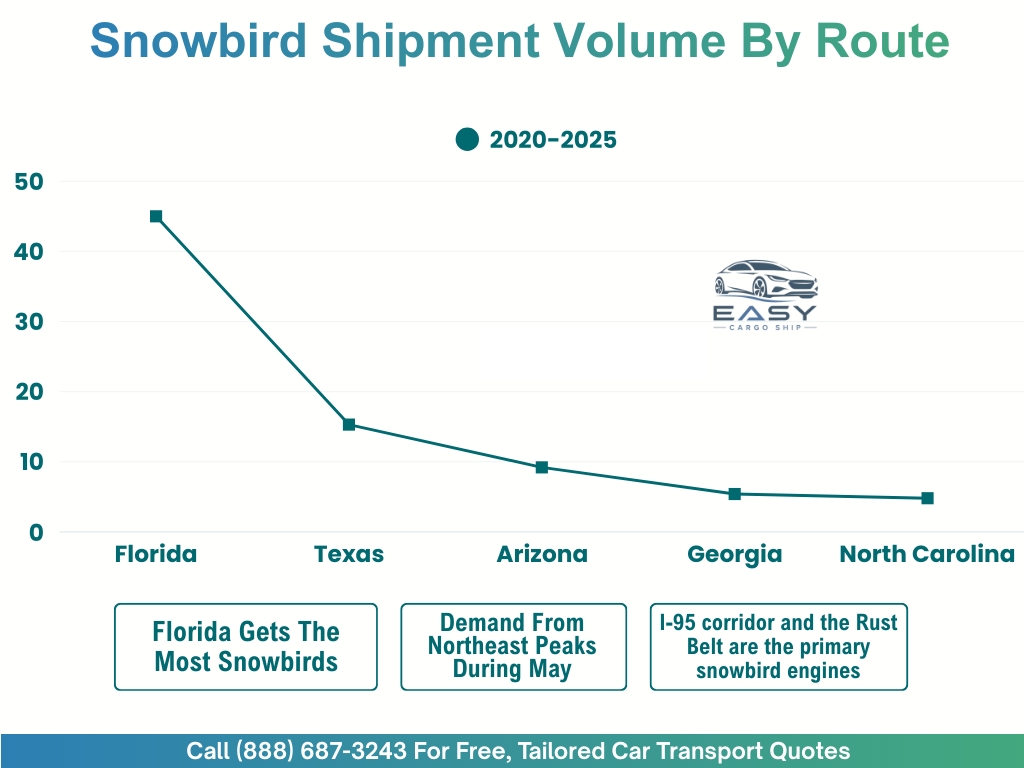
We concluded that Florida received around 45.0% cars, Texas got 15.3%, and Arizona around 9.2% shipments. Our data confirms that the I-95 corridor and the Rust Belt are the primary snowbird engines. We observed that most drivers stay south for consistent winter pay, and people head back north once spring arrives almost every year.
| Snowbird Destination State | Percentage of Share |
|---|---|
| Florida | 45.0% |
| Texas | 15.3% |
| Arizona | 9.2% |
| Georgia | 5.4% |
| North Carolina | 4.8% |
Our data also highlighted that regional busy months are different for car shipping across the country. We noticed an increase in demand from the Northeast during May, whereas the South and West Coast demand peaks during June.
We noted that semi-truck drivers usually stay in high demand areas for better money, following clear weather patterns every year. We found out that the demand shifts north in spring.
State to State Car Transport Corridor Seasonality
Our data showed 3.3% total shipments were for Texas and California. We observed that the routes between these states are active all year long.
Whereas, the shipment from California to Texas peaked in June, hitting 12.2%. We noted that Texas to California orders were 13.1%, which was slightly higher than New York to Florida, accounting for 11.6% shipments. However, the same route backwards, from Florida to New York saw 21.1% shipments in May.
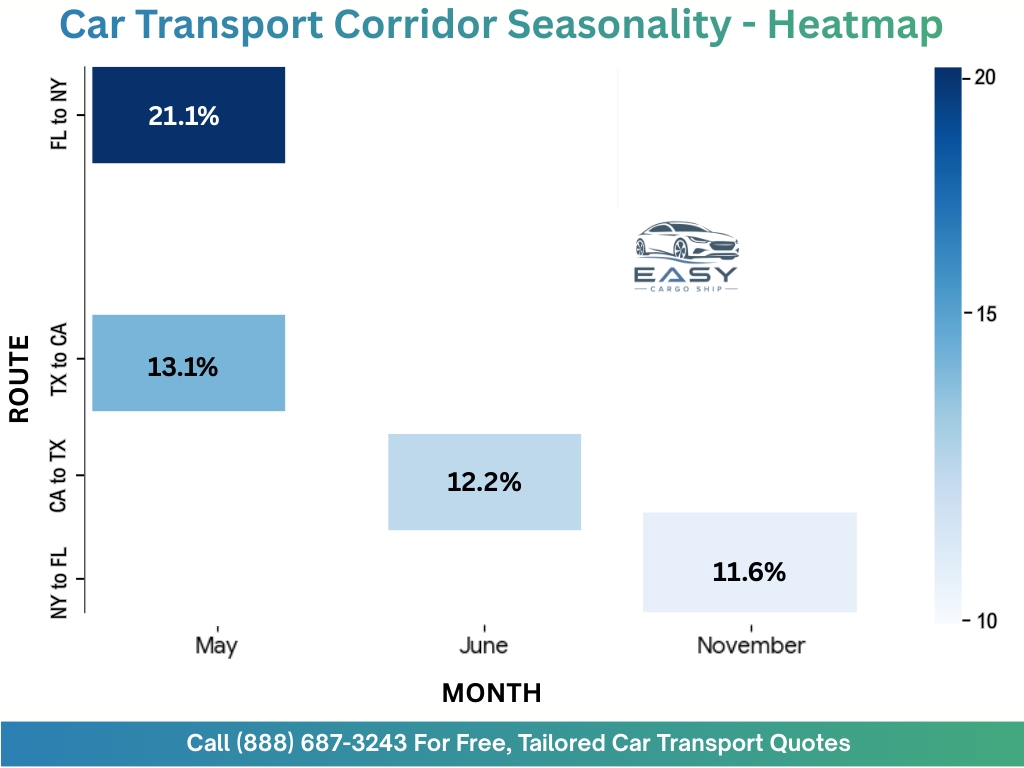
Lastly, we noted that Texas to Florida shipments were only 0.7%. Our data showed that most shipments involve cars moving between larger economic hubs.
- NY to FL peaks 11.6% in November
- FL to NY peaks 21.1% in May
- TX to CA peaks 13.1% in May
- CA to TX peaks 12.2% in June
Vehicle Shipment Type By Seasonality
Our data highlights the shifts in demands based on how owners use their cars. We saw that every vehicle segment shows a different story throughout the year.
Luxury and Convertible Vehicle Shipping Trends
We saw a peak in exotic car shipment right before summer. Our data showed that we shipped 19.1% luxury cars over five years. And, June is always the busiest month, accounting for 11.2% shipments.
We also tracked around convertible car moves, with May being the peak (12% shipments) month. We also noted a great surge in spring as the convertible car shipments were 28.7% during March to May.
Furthermore, we saw 9.8% of classic cars being shipped during July. We connected the dots to conclude that people want their luxury, convertible, and vintage cars ready by summer, perhaps for vacations. Our data showed that drivers prefer shipping expensive cars in enclosed carriers during spring rains.
| Vehicle Category | Peak Shipping Month |
|---|---|
| Luxury Vehicles | June (11.2%) |
| Convertibles | May (12.0%) |
| Classic Cars | July (9.8%) |
We noticed that April and May are busy months for premium brands and people avoid shipping them during December and January. Therefore, carriers charge a premium for special shipping during springs as the demand for luxury transport increases.
New, Old & Classic Car Transport Trends
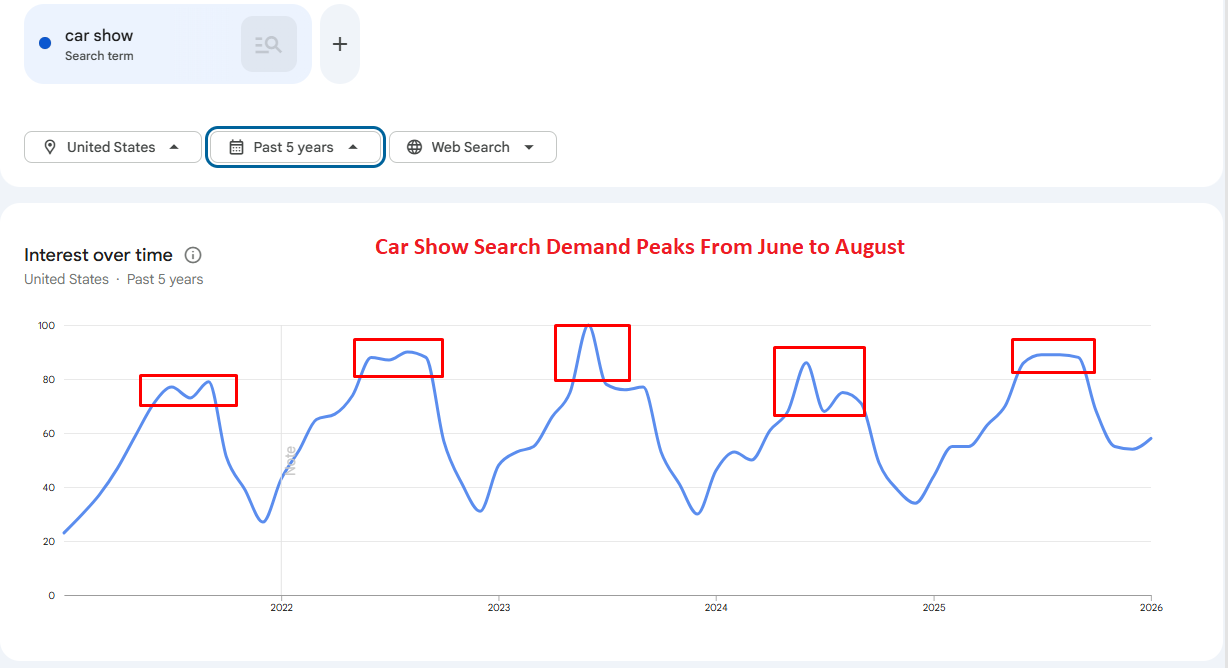
We noted that classic car shipments are usually tied to major car show seasons which mostly happen between June and August. Here’s a demand graph for car shows from Google Trends:
Coming back to our shipment data, we tracked around 12.2% car shipments were classics built before the year 2000. Our data showed that July saw 9.8%, while June and August saw 28.9% shipments.
We also saw around 22.1% car shipments from November to January as owners want to protect their classic cars from road salt and snow. Our data indicated that there is a steady demand for specialized classic car carriers throughout the year.
Our data highlighted that newer vehicles follow the standard market trends very closely. We noted 22.6% shipments were newer cars from 2020 or later. June saw 11.9% car shipments for these newer models.
Older vehicle shipments from 2000 to 2019 were 65.1%. We saw that even older cars saw a peak shipment with 11.6% orders in June.
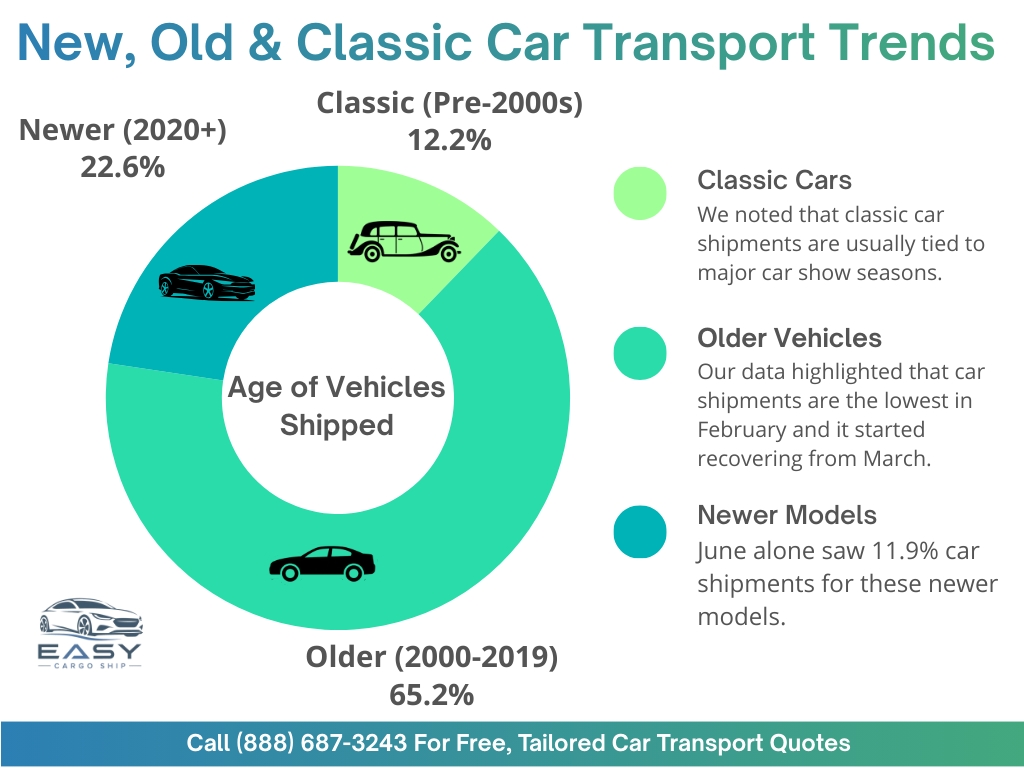
With the help of our data, we concluded that most cars move during summer no matter old or new. We noted that newer cars shipments were due to job locations, and older cars shipments were for sales between private owners.
- Newer Cars (2020+) shipments peak in June (11.9% share)
- Older Cars (2000-2019) shipments peak in June (11.6% share)
- Classic Cars (Pre-2000) shipments peak in July and August (28.9% share)
Our data proved that summer is the busiest season. We noted a slight delay for classic car shipping peaks compared to daily drivers. From collector car owners to regular cars, every category wants shipments when roads are dry and clear.
Lastly, we also observed that car shipments are the lowest in February and it starts recovering from March.
Seasonal Car Transport Economic and Price Factors
With the help of our data we calculated the change in shipping costs on the basis of season. We noted that shipments rates are lower during winter and high during summer months. Our data suggested that every month has a different shipping average cost.
Car Shipping Seasonal Pricing Fluctuations
We noticed that June is the most expensive month for shipping, with an average of 1,319 dollars. We noted a significant drop in price during December, averaging at 1,077 dollars. We saw a difference of 242 dollars by shipping in December.
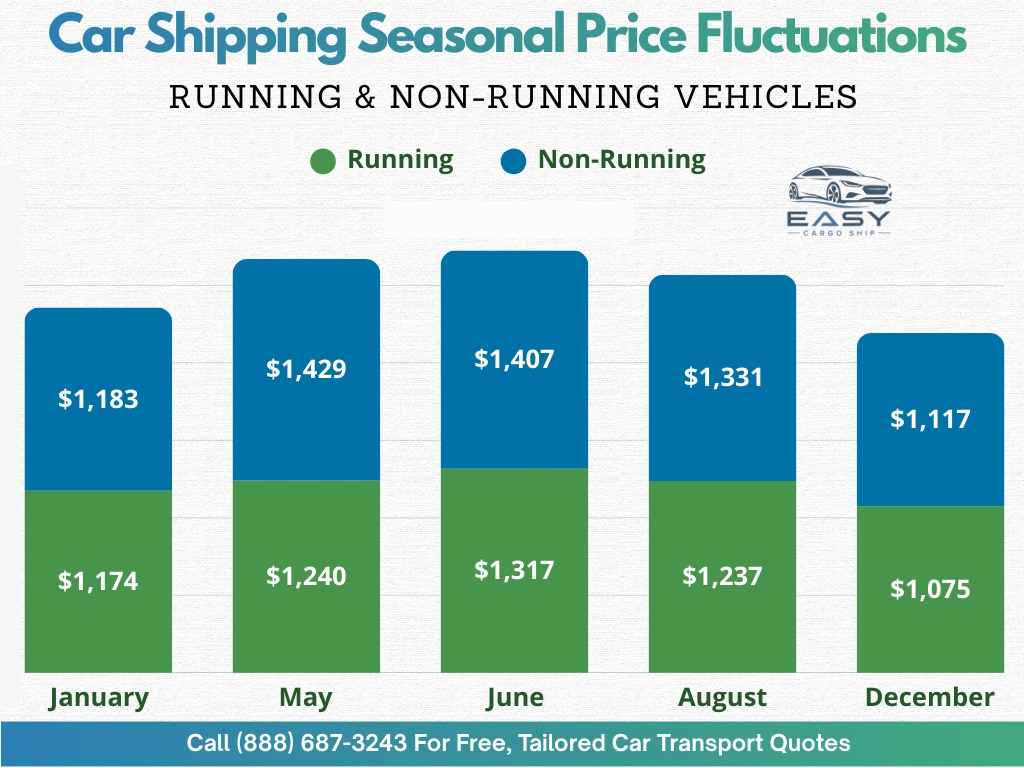
We saw that the prices remained low during November at 1,088 dollars, while August shipments cost around 9.7%, averaging at 1,240 dollars. Our data suggested that you can find budget friendly deals in late fall.
| Month Name | Running Vehicles | Non Running Vehicles |
|---|---|---|
| January | $1,174 | $1,183 |
| May | $1,240 | $1,429 |
| June | $1,317 | $1,407 |
| August | $1,237 | $1,331 |
| December | $1,075 | $1,117 |
Price Sensitivity and Demand Correlation
Our data showed 92% correlation between shipping volume and price. We noted that whenever the car shipping demand increases, the price also increases. We noted that the price drops during winter and spikes during peak vehicle shipping seasons.
Our data showed the demand in June reached 11.4% and the prices are the highest during the month. Whereas, February had only 6.2% car shipments and the average price stayed near 1,092 dollars.
- June demand is 11.4 percent of volume.
- June prices are the highest all year.
- February demand is 6.2 percent of volume.
- February prices stay near 1,092 dollars average.
Running vs Non Running Vehicle Seasonality
We saw that cars that are inoperable cost more to move every time. Our data revealed that non-running cars average 1,201 dollars per trip, while running cars average 1,119 dollars. We saw that the carriers charge more for extra labor and winches.
The data highlighted that people ship their broken cars excessively in May and the prices hit 1,429 dollars during the month.
We observed that car owners pay a premium for broken car shipping. Nevertheless, if you can wait for the fall to ship, you will save some money.
Car Shipping Carrier Type Demand By The Season
Most people pick open trailers for their car moves. This method handles almost all the shipping traffic today. Open carriers dominate with 90.7% shipments, and enclosed carriers move 9.3% vehicles. We noted that car owners choose the carrier type according to their car value.
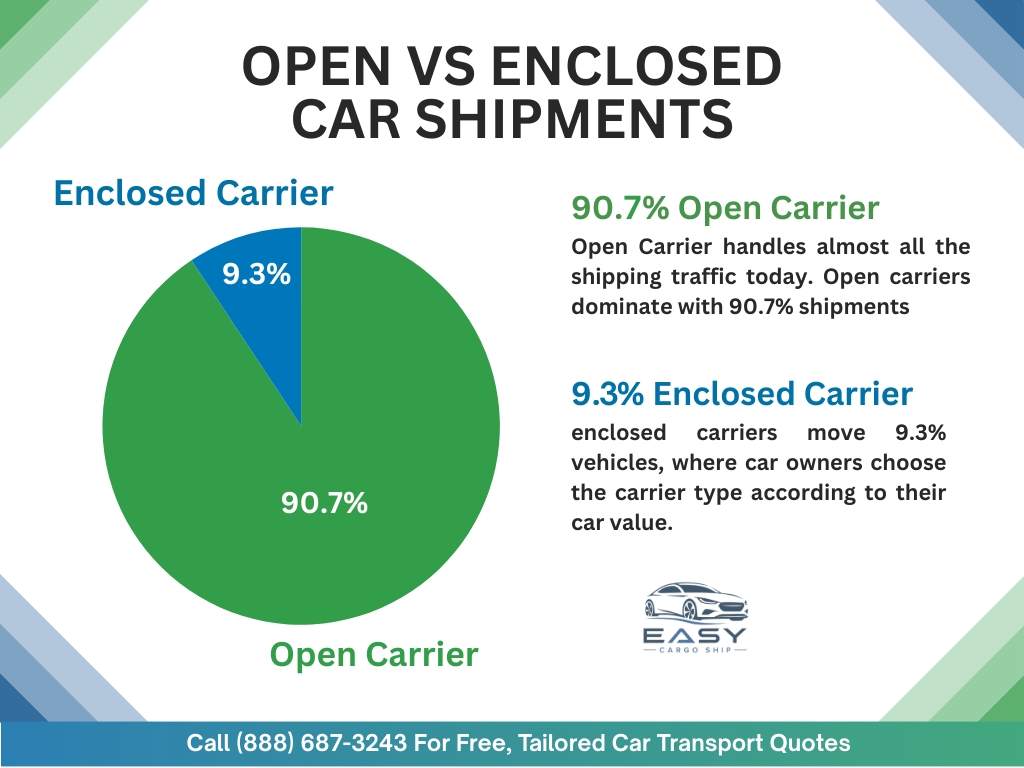
We noticed seasonal vehicle shipping trends change with the weather. Our data suggested most drivers prefer open racks, and enclosed carriers move high value cars.
To better understand seasonal shifts, the following subsections analyze how each carrier type’s specific annual volume is distributed month-to-month. While open trailers handle the vast majority of total vehicles, these percentages highlight the ‘peak’ and ‘off-peak’ months unique to each individual shipping method.
Seasonal Open Transport Volume Patterns
The percentages below represent the distribution of open-trailer moves throughout the year. For example, the 11.6% peak in June indicates that over one-tenth of all annual open-trailer shipments occur in that month alone, driven by the summer moving season. This is because summer is when most families relocate and when kids are out of school.
We noted that May followed with 10.9%, while July saw 10.6% car shipments. We observed that open carrier demands dip during the cold weather.
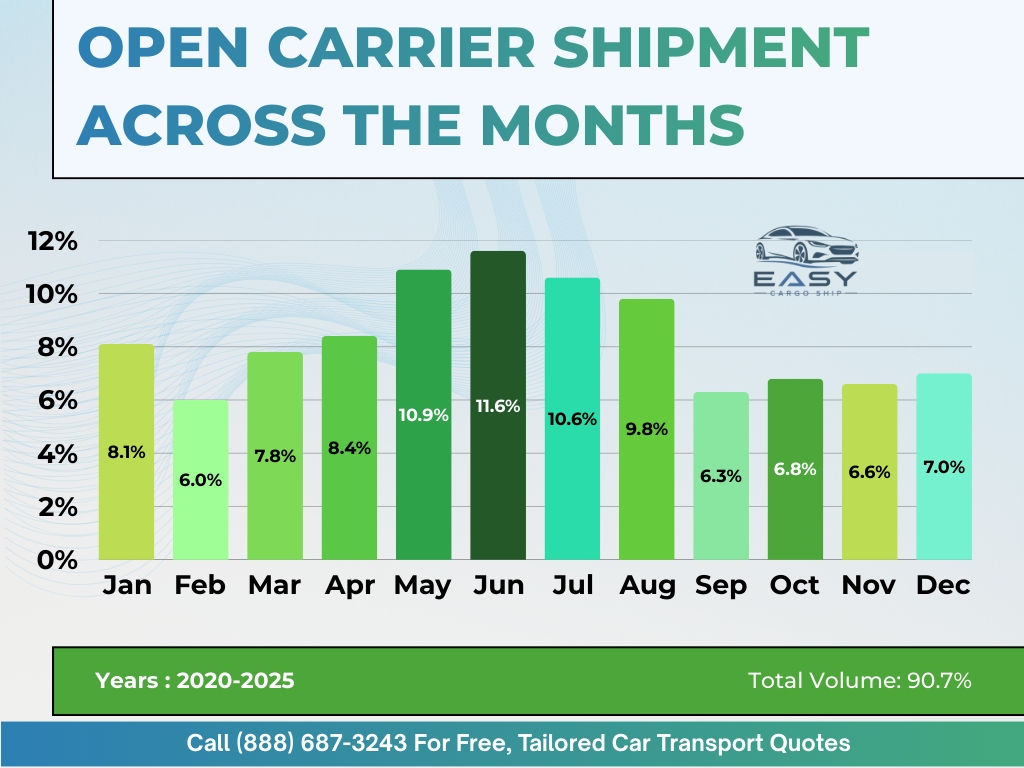
Our data highlighted that February received only 6.0% shipments, making it the slowest month for open shipping. January, however, got a better volume with 8.1% shipments.
According to our data, September also showed lower shipment demands as it got only 6.3% car shipments. We noticed a higher volume during the warm seasons when owners save money by choosing these cost effective carriers.
| Month Name | Open Volume % |
|---|---|
| January | 8.1% |
| February | 6.0% |
| March | 7.8% |
| April | 8.4% |
| May | 10.9% |
| June | 11.6% |
| July | 10.6% |
| August | 9.8% |
| September | 6.3% |
| October | 6.8% |
| November | 6.6% |
| December | 7.0% |
Seasonal Enclosed Transport Volume Patterns
While enclosed transport represents a smaller niche of the total market (9.3% of all shipments), according to our data, enclosed shipping demand stays consistent throughout the year. The following percentages show the internal monthly breakdown for enclosed shipments out of total enclosed moves, reflecting a more stable demand from collectors and luxury owners regardless of the season
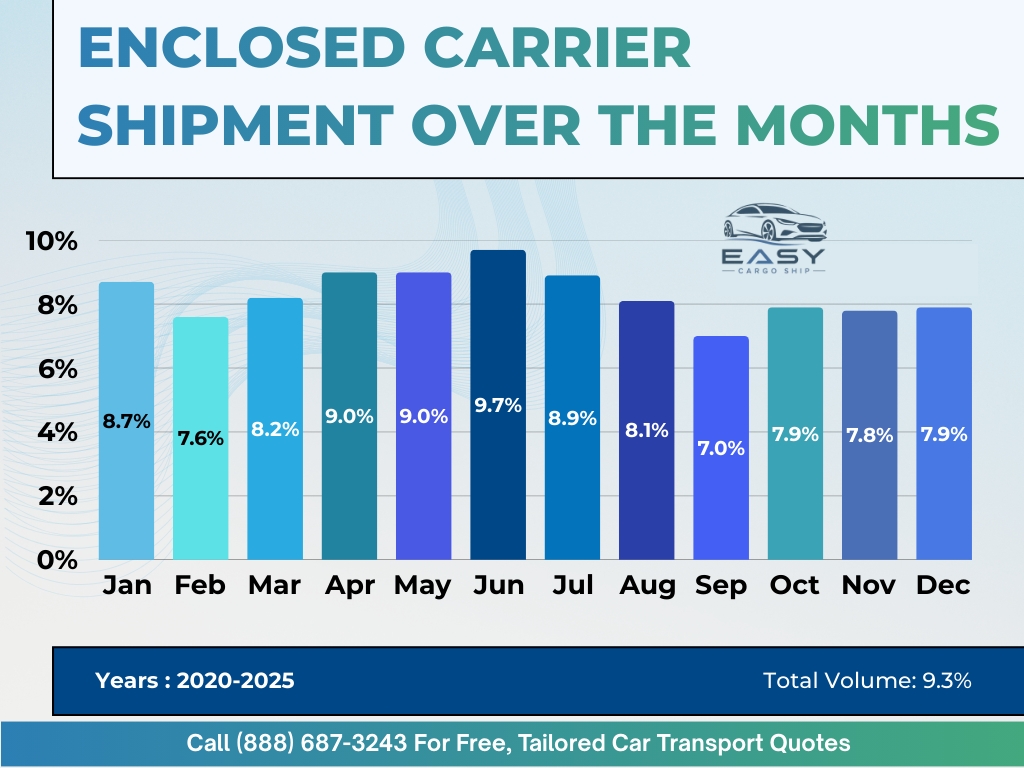
We noticed that peak vehicle shipping seasons affect enclosed trailers much less. Our data showed that June led with 9.7% shipments, whereas April and May saw 9.0% shipments.
We observed that owners use enclosed trailers for winter weather protection as January moved 8.7% shipment. Our data highlighted that February saw 7.6% shipments, but September moved 7.0% vehicles, which was the lowest of all.
Our data also showed that auto transport yearly trends favor covered protection. We noticed that many collectors ship their cars during winters and prefer enclosed carriers as they keep luxury cars safe from snow and road salt.
| Month Name | Enclosed Volume % |
|---|---|
| January | 8.7% |
| February | 7.6% |
| March | 8.2% |
| April | 9.0% |
| May | 9.0% |
| June | 9.7% |
| July | 8.9% |
| August | 8.1% |
| September | 7.0% |
| October | 7.9% |
| November | 7.8% |
| December | 7.9% |
Auto Transport Carrier Type Pricing Differences by Season
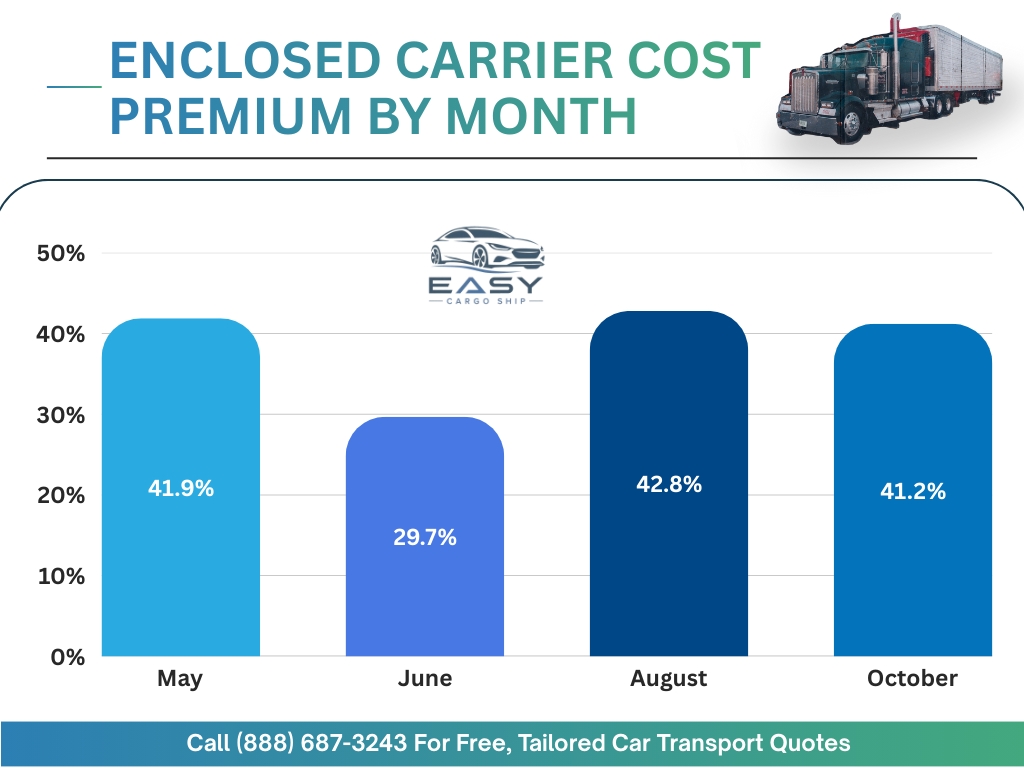
We noticed that the premium for enclosed transport varies throughout the year. Our data showed us the highest percentage premium is during August. We saw that enclosed carriers cost around 1,714 dollars, whereas open carriers cost only 1,201 dollars. We noted that this difference created a massive 42.8% price premium for enclosed carriers.
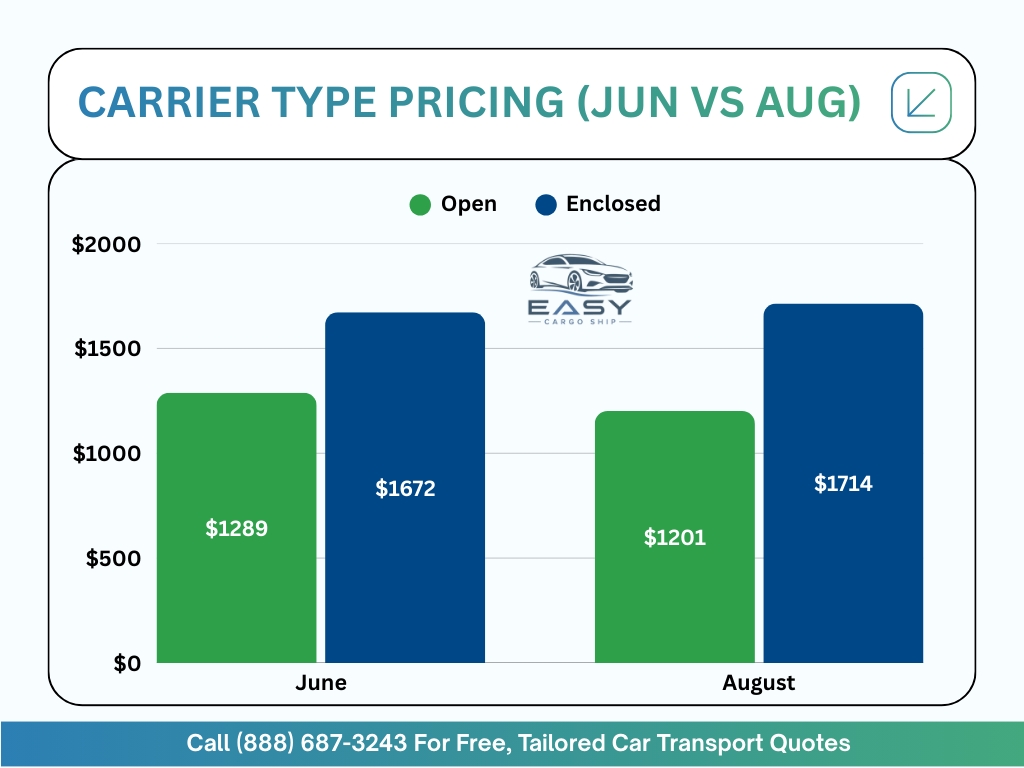
Our data indicated that June saw the lowest percentage premium, when enclosed quotes averaged 1,672 dollars against 1,289 dollars for open carriers. We saw that car owners only paid a 29.7% price premium during June, which is considered a busy month.
This might be due to increased demand for open carriers during summer, so their rates go up as well, narrowing the price gap from 42.8% to 29.7% between both carrier types.
Overall, we noticed that car owners get a better relative deal on enclosed carriers in June.
- August Enclosed Premium: $513 (42.8% extra)
- May Enclosed Premium: $506 (41.9% extra)
- October Enclosed Premium: $437 (41.2% extra)
- June Enclosed Premium: $383 (29.7% extra)
Our data related to pricing proved that enclosed carriers have more stable costs. We saw that peak vehicle shipping seasons impact open carriers more. We observed that the price jumps 19.8% between winter and summer months.
Whereas, our data also showed that enclosed trailer prices only fluctuate by about 11.1% during the same time. We noticed that car owners see a more predictable bill when they book an enclosed carrier. Our data showed that shippers pay more for the exclusive space inside an enclosed trailer.
We observed that carriers often have fewer enclosed options available in any region. And our data also highlighted that car owners find seasonal car transport patterns dictate the final prices. We found out that comparing both shipping options before booking a spring shipment is a smart move.
External Seasonal Car Shipping Demand Factors (Vacations, Weather, School/College Sessions)
Our data highlighted that external events such as major holidays and weather cycles directly change how car owners ship cars. Our data showed that markets slow down when families are celebrating events.
We also saw how natural events such as hurricanes or winter storms create sudden spikes in specific regions. We observed that these factors which are outside of anyone’s control can also dictate the flow of trucks.
Holiday Impacts on Shipping
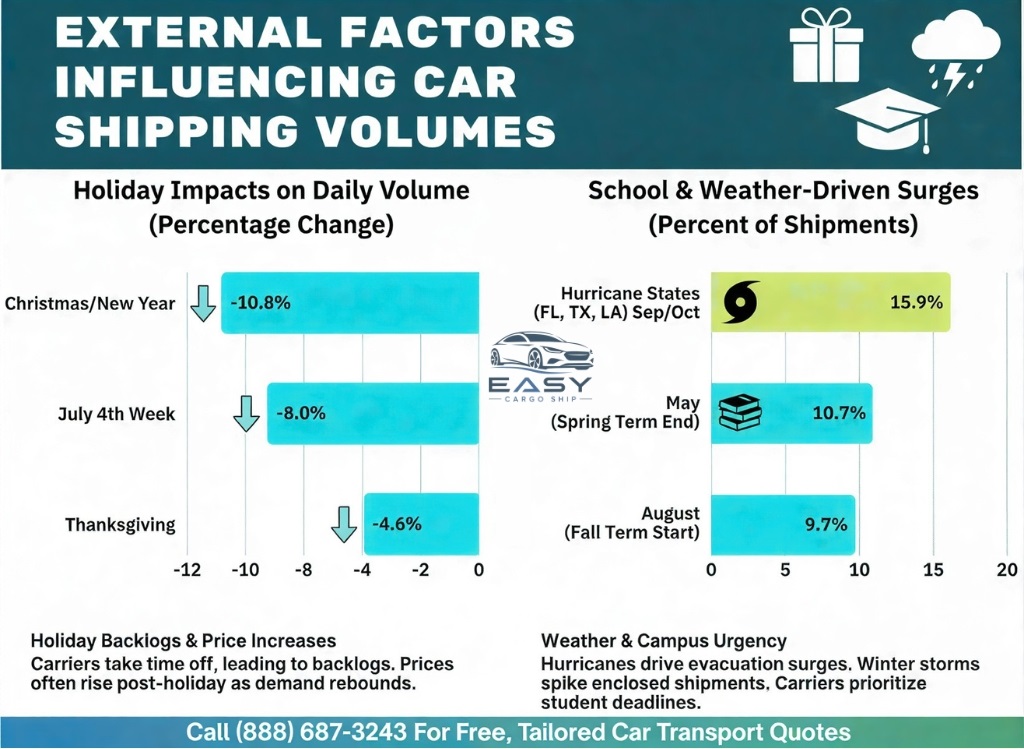
Our data showed that major holidays cause a dip in car shipments volume. We observed that the daily volume dropped by 11% during the Christmas and New Year window. According to our data, the daily average in December saw a 10.8% decrease.
We also observed a similar pattern for Thanksgiving as the daily average dropped by 4.6%. Another drop was observed during 4th of July, with daily shipment volume going down by 8%.
| Holiday Period | Percentage Change |
|---|---|
| Christmas/New Year | -10.8% |
| Thanksgiving | -4.6% |
| July 4th Week | -8.0% |
During these events, we see a backlog of shipments as carriers also take time off to spend with their families during holidays. We also noticed that the prices often increase after holidays as the demand increases.
School Calendar Influence
Our data indicated that the academic year creates a massive wave in the auto transport market. We observed that May saw 10.7% vehicle shipments. Our data also showed that August saw another surge in August with 9.7% of total shipments as the fall semester began.
We noticed that many parents choose to ship a car to college instead of long drives which creates an influx of shipment demand.
Our data showed that carriers prioritize these student vehicle shipments more due to strict deadlines. We found that campus transition heavily influences car shipping demand by month.
Weather Related Spikes
Our data also highlighted that extreme weather changes the geographic demands. We observed how hurricanes in the South create evacuation surges during September and October. Our data included 15.9% of regional shipment volume out of Florida, Texas, and Louisiana during the two months.
We also noted that many owners ship their cars north to avoid the potential flood damage, whereas winter storms in the Midwest and Northeast cause a sudden spike in enclosed shipments.
- Hurricane states (FL, TX, LA) peak in late September.
- Winter storm demand spikes for enclosed trailers in November.
- Flooding events in the Midwest drive urgent spring moves.
Our data helped us analyze how weather-related events create a temporary peak vehicle shipping season in specific states. It also indicated that carriers raise rates to accommodate these urgent “rescue” shipments during storms.
Car Shipping Hauler Route & Distance Patterns By Season
According to our data, operations change behind the scenes to keep up with the changing seasons. We saw trucks moved longer distances during clear weather, but certain months created a one-way flow that leaves trailers empty.
With the help of our data, we observed that fleet owners and dealers have their own shipping cycles. We noticed that these operational shifts affect how quickly your car gets picked up.
Carriers have to balance their loads to generate profit throughout the year. We found that maintaining efficiency during the transition months is hardest. Our data helped us track where the trucks move and why.
Car Hauling Distance Patterns by Season
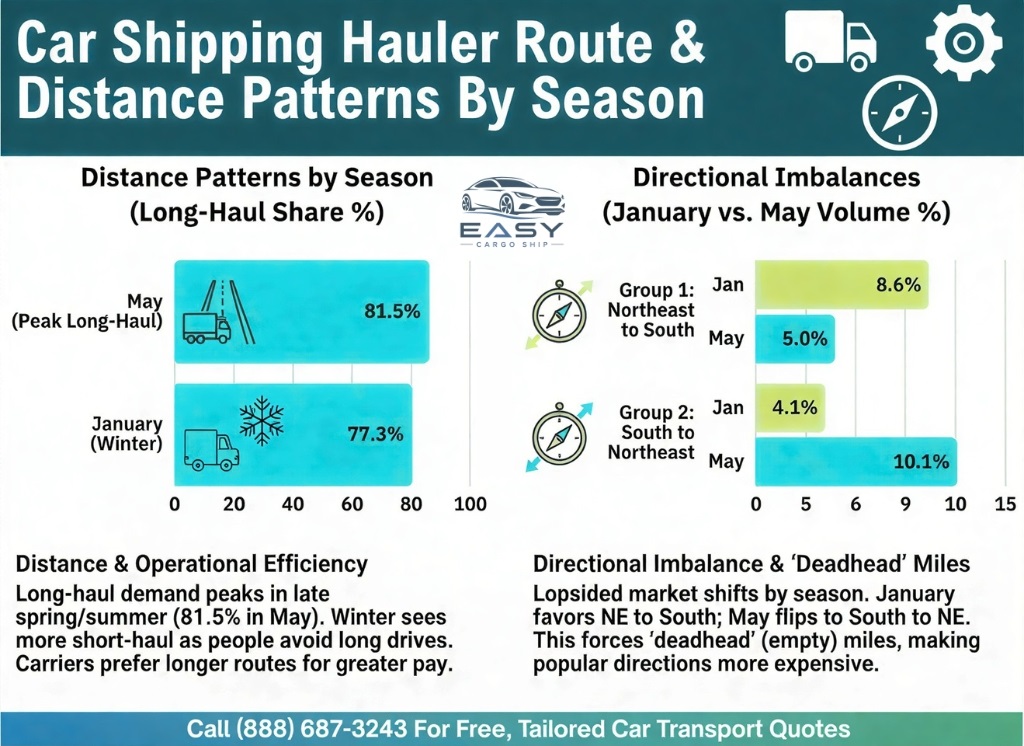
We observed that long-haul shipping demand is much higher during late spring and summer, accounting for 81.5% of all shipments in just May. Our data also showed us that around 77.3% long-haul shares are seen in January. We noticed that families that relocate for work usually move across state lines during the summer.
Our data also suggested that winters see a higher percentage of short-haul shipments within the same region as people avoid long drives during snowy seasons. Our data helped us see auto transport yearly trends favor long-distance travel when roads are safe. We noted that carriers prefer longer routes due to greater pay.
Auto Moving Carrier Directional Imbalances
Our data helped us see the lopsided shift in the car shipping market that depends on the time of the year. We saw 8.6% of auto shipments in January move from the Northeast to the South.
Whereas, only 4.1% of total January volume moved in the opposite direction during the same time, creating a massive shortage of cars heading north for returning trucks. We also saw the pattern flip completely by May when 10.1% of total May shipments were moved North and only 5% were shipped South.
Our data highlighted seasonal car transport patterns force drivers to take “deadhead” miles with empty trailers. We saw that car owners pay more when they ship in the same direction as everyone else and finding a carrier is easy while moving against the seasonal crowd.
| Route Direction | January Volume | May Volume | Trend Shift |
|---|---|---|---|
| Northeast to South | 8.6% | 5.0% | Decreasing |
| South to Northeast | 4.1% | 10.1% | Increasing |
Our data also suggested that imbalances peaked during April and May. We noticed that drivers struggle finding cars to fill their return trips from the North. We realized that this is the reason behind lower prices for cars moving South in the spring as carriers want to avoid driving empty trucks. With the help of our data, we concluded that car owners can get a great deal by shipping “backward” against the seasonal grain. We also noticed that most customers are unaware of these hidden gaps in the shipment industry.
We’re Available 365 Days to Ship Vehicles Across The United States:
If you want to move your car, motorcycle, boat, RV, trucks, Vans, or heavy equipment anywhere within the US or even internationally, Easy Cargo Ship is available throughout the year to take care of the logistics for you. Contact our team at (888) 687-3243 or use our free estimated quote calculator today to get started.