
We collected the latest shipping data which revealed a massive divide. We noticed that even today gasoline cars have remained the dominant choice. Our records showed us that 97.01% gasoline car units were shipped. While, the percentage for electric vehicles was only 2.99%. Furthermore, we noticed that the gasoline car shipping volume highlighted the traditional market.
We also observed that most people still choose gas vehicles for long moves. For every one EV, there were thirty-three gas cars shipped.
With a collected sample size of 72,000+ car shipments from 2020 to 2025 and noticed a slow and steady change. Traditional engines still represent most car moves. Our data suggested that shippers handle gas cars at a massive scale. We also noticed that electric cars are finding their own niche now with enclosed trailers. Moreover, with this data we noticed the buying habits across the country. Let’s unpack all that in this 5-year study.
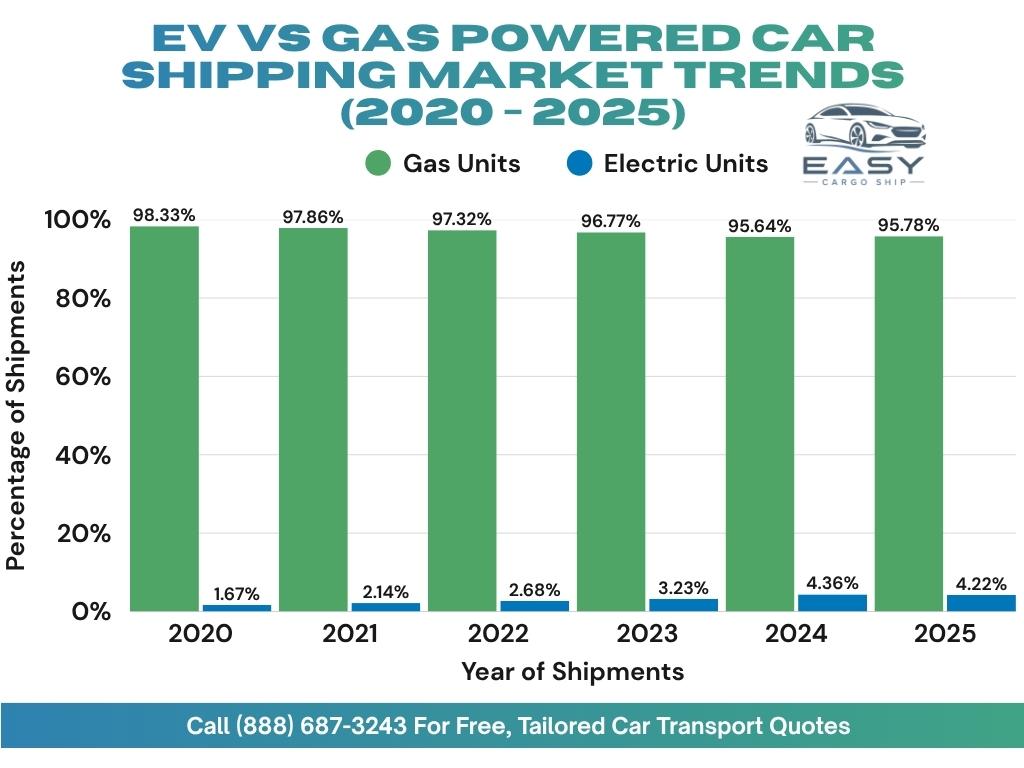
EV Vs Gas Powered Car Shipping Market Trends Over Time (2020 - 2025)
We noticed that the share of auto transport by fuel type changes yearly. According to our data, 1.67% electric cars were shipped in 2020. But, in 2021, the car shipment percentage grew to 2.14%.
By the year 2022, we noticed an increase in the electric vehicle shipping trends to 2.68%. Then, the interest grew to 3.23% in 2023. According to our data, the EV share saw the highest jump in 2024 to 4.36%.
Lastly, we noticed that 4.22% electric cars were shipped in 2025. Our data highlighted that electric vs gasoline car shipping ratios are narrowing, but very slowly.
| Year Shipped | Electric Units | Gasoline Units |
|---|---|---|
| 2020 | 1.67% | 98.33% |
| 2021 | 2.14% | 97.86% |
| 2022 | 2.68% | 97.32% |
| 2023 | 3.23% | 96.77% |
| 2024 | 4.36% | 95.64% |
| 2025 | 4.22% | 95.78% |
While gas cars are still the leaders, electric vehicles continue to win a small share of market space annually. We’re expecting a long-term change in the vehicle shipping market as people are trusting the new, eco-friendly technology more.
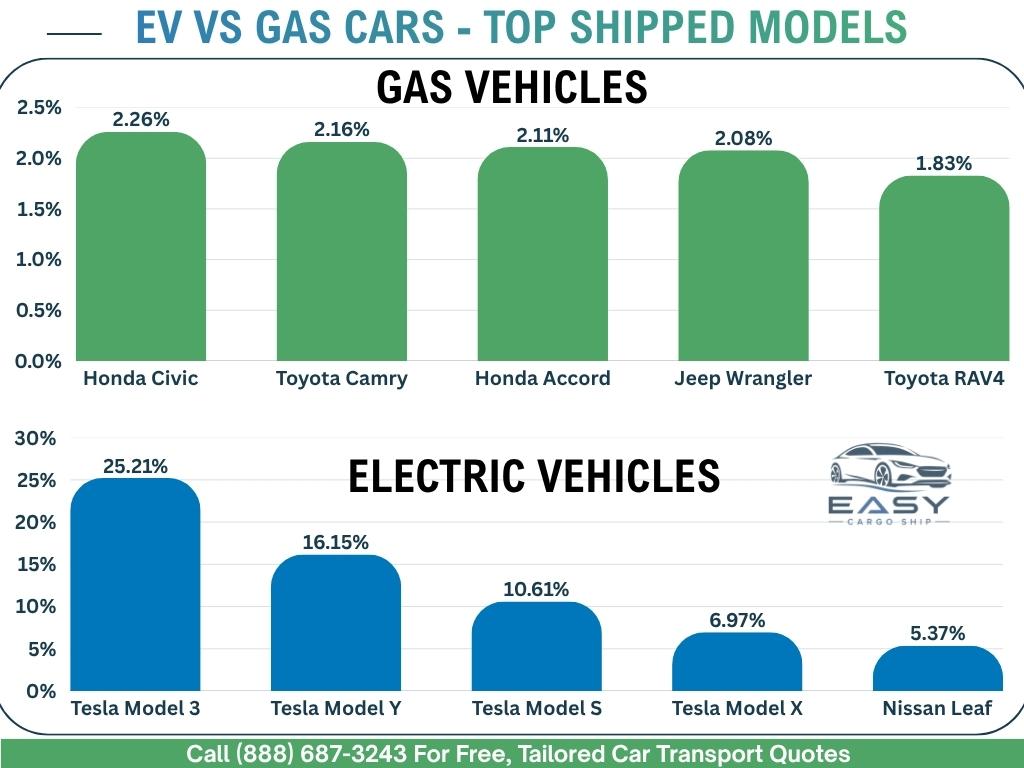
Top Shipped EV vs Gas Car Models Comparison
Our data also revealed that certain models lead the gas car shipment charts. We found out that the Civic model leads with 2.26% shipments, while the Camry orders hit 2.16% of all gas shipments.
We also noticed that Accord models shipments were 2.11%, Wrangler hit 2.08%, and RAV4 orders were 1.83%. We saw that the most shipped cars are usually reliable sedans.
- Civic: 2.26% of gas
- Camry: 2.16% of gas
- Accord: 2.11% of gas
- Wrangler: 2.08% of gas
- RAV4: 1.83% of gas
We noticed a specific brand dominating the electric car sector. It is Model 3, leading the chart with 25.21%, followed by Model Y with 16.15%, Model S with 10.61%, and Model X with 6.97%. Whereas, the Leaf models reached 5.37%. We observe there is a high brand loyalty in this segment.
- Model 3: 25.21% of EV
- Model Y: 16.15% of EV
- Model S: 10.61% of EV
- Model X: 6.97% of EV
- Leaf: 5.37% of EV
Most top gas models are budget-friendly sedans while electric shipments are usual luxury brands.
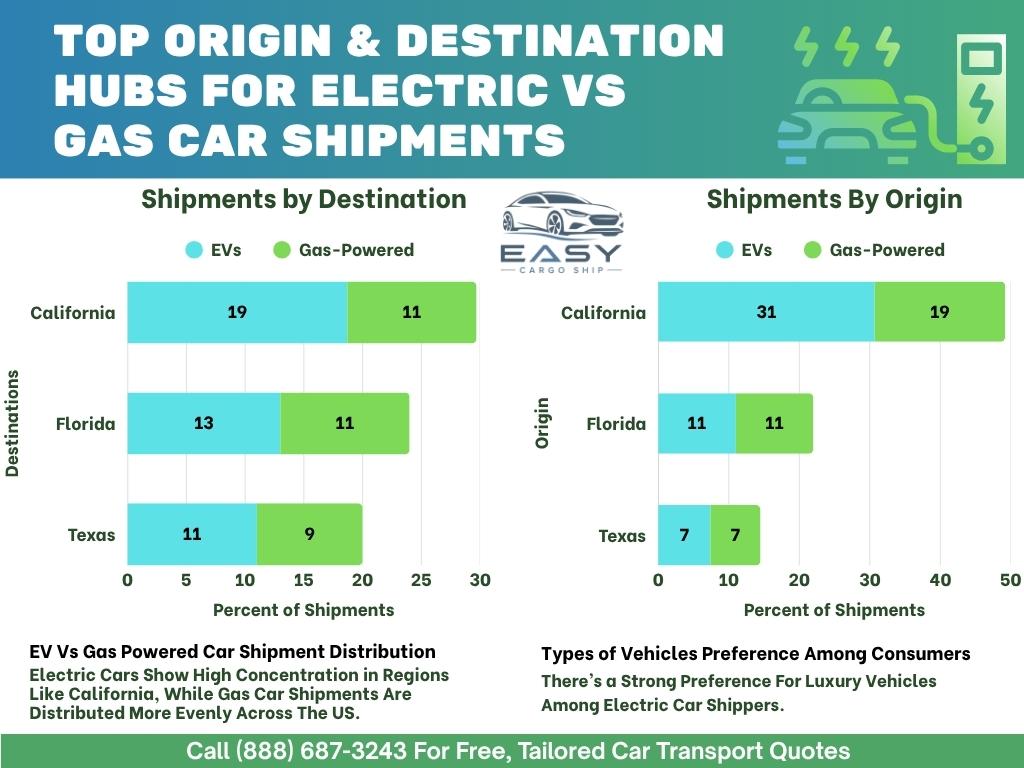
Geographic Patterns of Car Shipping Between EVs and Gas Guzzlers
Our data showed the places where cars move the most. Coastal hubs have stood out, but we see consistent patterns across the country. We also observed that all regions contribute to the national flow.
Top Origin and Destination EV vs Gas Car Transport Hubs
Our data suggested around 30.7% electric car shipments originate from California, followed by Florida and Texas with 11.0% and 7.4% respectively.
When it comes to gasoline cars, California sends around 18.5%, followed by Florida sending out 11.0%, and Texas around 7.1%.
However, we noticed different state rankings for gas vehicle deliveries. Florida received 11.3% gasoline cars, California and Texas received 10.8% and 8.5%.
On the other hand, for EVs, California stayed on the top, accepting around 18.7% electric vehicles, Florida received 12.9%, and Texas got 10.5% EVs.
Our data indicated where people have been moving the most. Large economies such as California and Florida dominate and gas cars are common in every major state. We noticed that electric cars cluster in wealthy coastal regions, showing us the regions where technology is most popular.
Electric Car Shipping Corridors Across The US
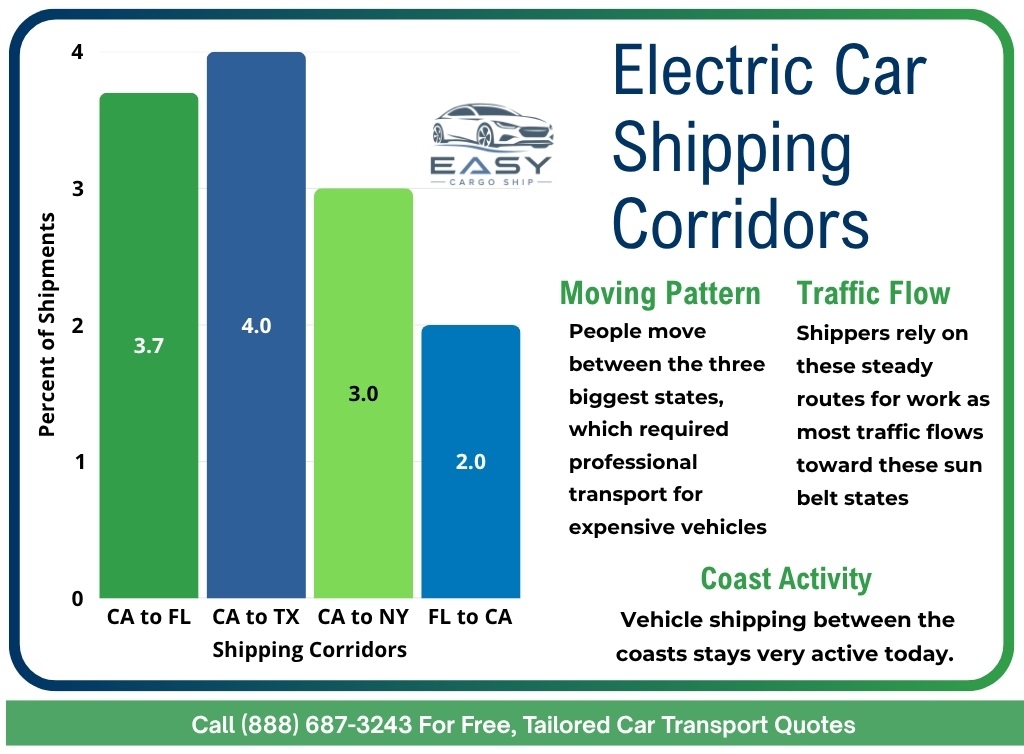
We observed some specific routes, California to Florida was at the top with almost 3.7% of total electric vehicle shipments. California to Texas was the second most used shipping route with 3.6% of overall electric car shipments, while California to New York car shipments were 2.5%. Other than that, the Texas to California route saw 2.3% electric car shipments, whereas Florida to California had around 1.9% moves. We noticed that major state pairs define electric vs gasoline car shipping lanes, which is the busiest in America.
- California to Florida: 3.7% of total EVs
- California to Texas: 3.6% of total EVs
- California to New York: 2.5% of total EVs
- Texas to California: 2.3% of total EVs
- Florida to California: 1.9% of total EVs
We observed long distance migration trends from our findings. Our data proved that people move the most between the three biggest states (CA, FL, TX), which required professional transport for expensive vehicles. Our data implied that shippers rely on these steady routes for work as most traffic flows toward these sun belt states. A key observation from our findings was that vehicle shipping between the coasts stays very active today.
Regional Concentration & Urban Trends in EV vs Gas Car Moves
One of the most remarkable discoveries from our data was to find out that the South region leads in total deliveries. It received around 39.5% electric vehicle shipments, while the West took around 35.5% units.
On the other hand, Southern states took 41.5% cars and Northeast states received 15.1% cars. Our data showed that auto transport by fuel type varies by region. We observed that warmer regions prefer all car types and cold states showed lower shipping counts.
| Destination Region | Percent Of Total Electric Units | Percent Of Total Gasoline Units |
|---|---|---|
| South Region | 39.5% | 41.5% |
| West Region | 35.5% | 30.3% |
| Northeast Region | 15.3% | 15.1% |
| Midwest Region | 9.6% | 13.1% |
Our findings also signaled that urban hubs see the highest gas car delivery rates, and cities like Austin and Seattle grab the lead.
On the other hand, electric cars mostly stayed in the metropolitan areas where charging stations are easier to find. We concluded that rural areas still rely on the traditional gas engines.
Electric vs Gas Vehicle Shipment Age & Value Insights
With our vehicle shipping data, we saw the clear differences in age and value. We found out that the most shipped electric cars are fairly new models, whereas the gasoline vehicles included a much wider range of ages.
Our data also highlighted how wealth impacts the shipping choice and the current habits of buyers.
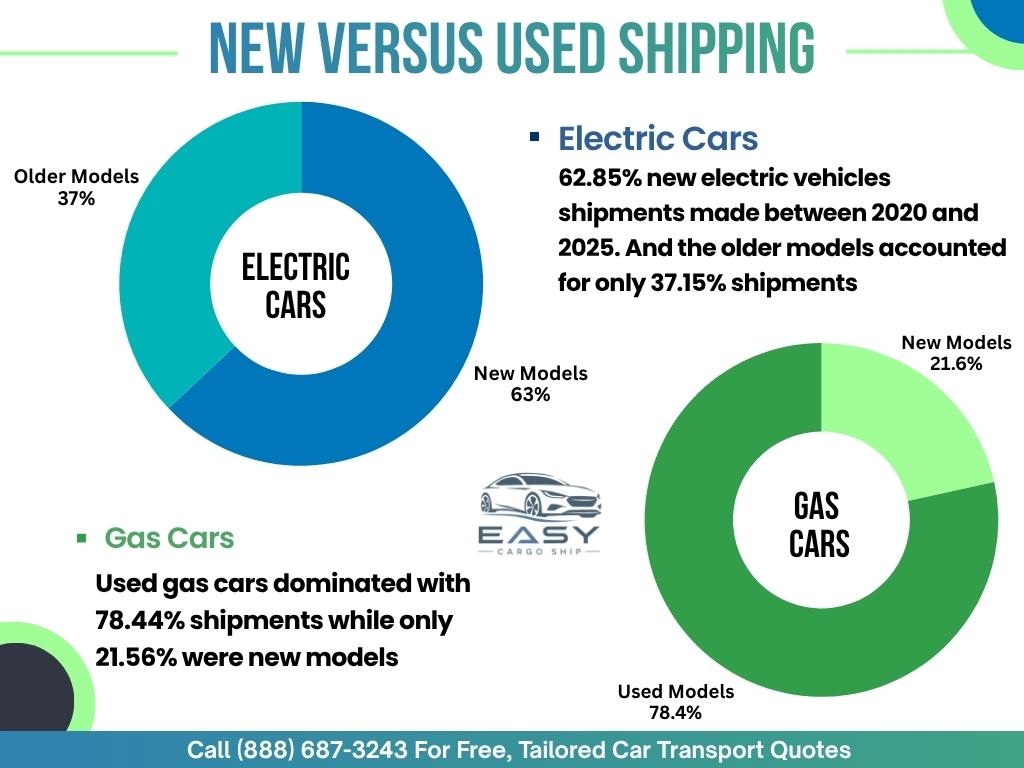
New Versus Used EV and Gas Car Shipping Distribution
We noticed that mostly recent models of electric cars were shipped. We tracked around 62.85% new electric vehicles shipments made between 2020 and 2025. And the older models accounted for only 37.15% of all EV shipments.
According to our data, used gas cars dominated with 78.44% shipments while only 21.56% were new models. Our gasoline car shipping volume highlights older vehicles that are much preferred for everyday use. But, new electric vehicle shipping trends focus on fresh inventory.
| Fuel Category | New Models (2020-2025) | Used Models (Pre-2020) |
|---|---|---|
| Electric Powered | 62.85% of all EV Shipments | 37.15% of all EV Shipments |
| Gasoline Powered | 21.56% of all Gas Shipments | 78.44% of all Gas Shipments |
Our data also pointed to the fact that buyers are moving the cars they had brought recently and gasoline car owners tend to hold their vehicles much longer.
Our data collected from the recent shipments proved the gap between auto transport by fuel type. There was a major split and gasoline engines are still relevant.
EV vs Gas Car Shipment Average Age Comparison
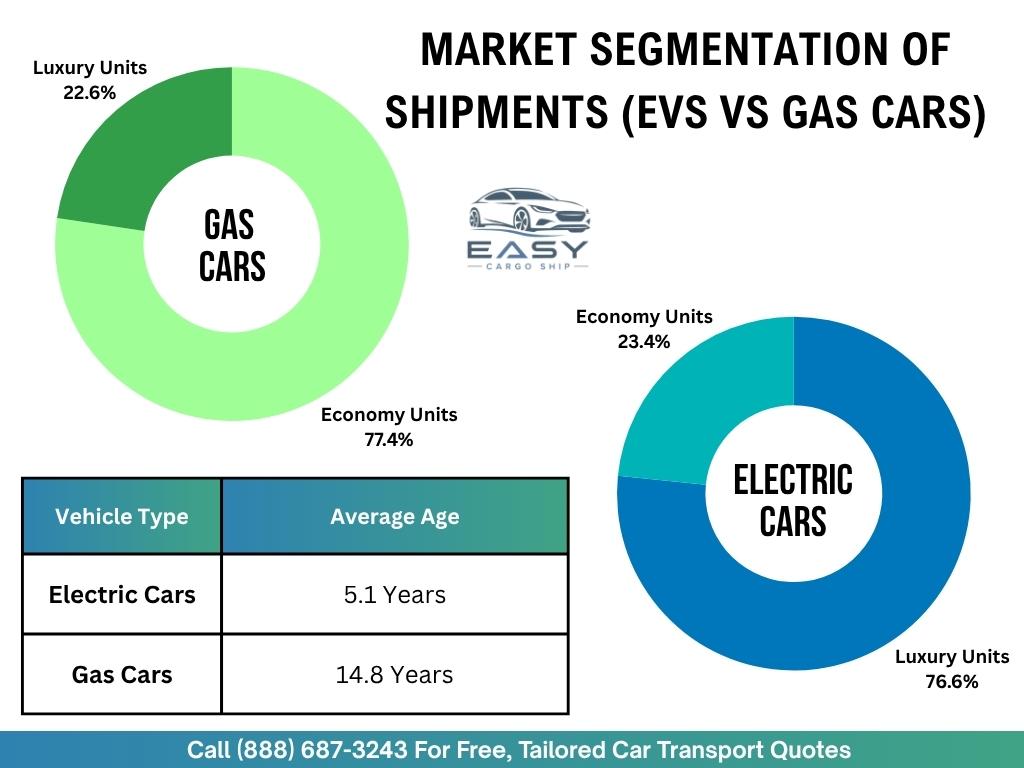
We observed a huge age gap between these car types. Most electric cars age around 5.1 years while many classic cars are still preferred. This difference is perhaps due to the rapid change in technology of electric cars, forcing buyers to trade in their electric cars more often or maybe because it’s a newer technology so it hasn’t aged that much till now. Whatever the case, our data showed us that gas cars are a more permanent vehicle choice.
- Average Electric Vehicle Age: 5.1 Years
- Average Gasoline Vehicle Age: 14.8 Years
- Percentage of Gas Cars Over 20 Years: 15.2%
- Percentage of EVs Over 10 Years: 8.4%
Premium and Luxury Segment Analysis
We noticed a pattern that most high-end brands made up the most electric car shipments. We identified around 76.60% of luxury electric vehicle shipments out of total EVs moved.
On the other hand, economy models only saw 23.40% volume. Furthermore, our data suggests that gasoline cars lean heavily on the economy brand names.
We saw that almost 77.36% of gas car shipments were economy models and only 22.64% of gas models were luxury. We also noticed the striking gap between these fuel types, as most electric shipments are high-value luxury cars.
- Luxury Electric Units: 76.60% of all EVs shipped
- Economy Electric Units: 23.40% of all EVs shipped
- Economy Gasoline Units: 77.36% of all gas cars shipped
- Luxury Gasoline Units: 22.64% of all gas cars shipped
Electric shipping is currently a luxury market activity. Most people shipping EVs have higher budgets. They move expensive cars between major urban centers. Gas car shipping serves the general public more.
Economic & Logistics Factors Behind EV vs Gas Car Transportation
Our data showed that logistics costs are dependent on more factors than just the distance of the trip. We compared prices on the same shipping routes to check whether batteries increase the bill or not. We observed that on average, shipping an electric car costs around $1,195.81, which is slightly higher than a gas car ($1,188.71) on the same route.
We noticed that weight is not usually the major impact on the cost. Most carriers use the same pricing logic for both types. But, we observed that some specialized routes have much bigger price swings for owners today.
EV vs Gas Car Shipment Route-Specific Cost Analysis
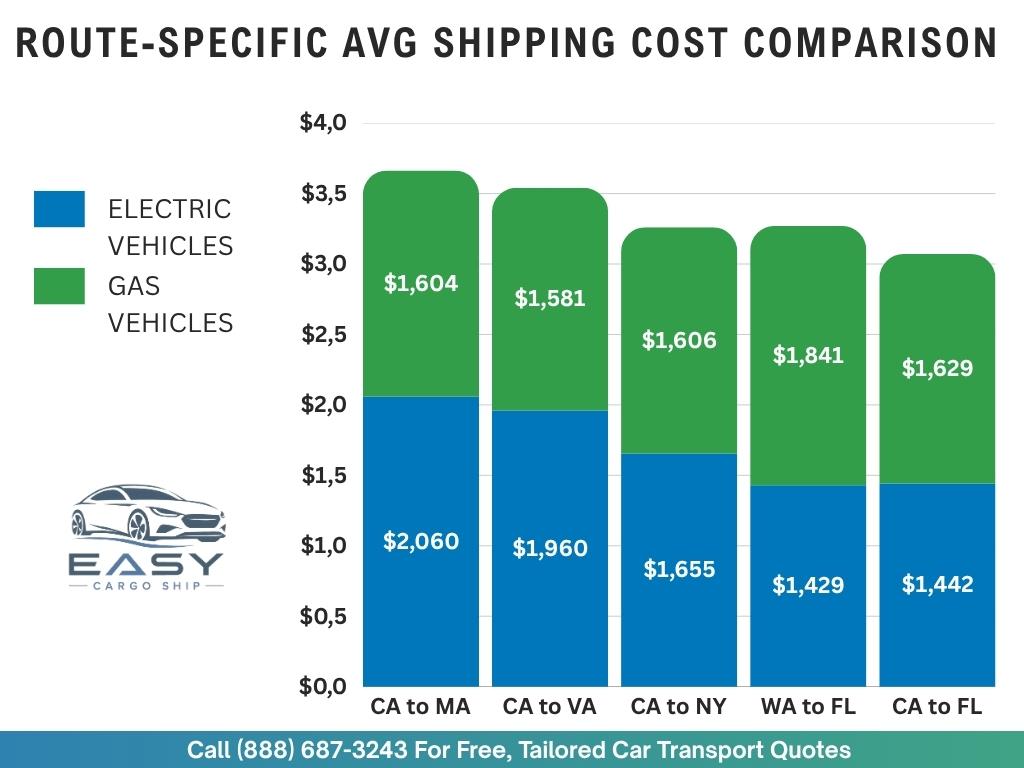
Our data drew a pattern to explain the electric vs gasoline car shipping price gap. We noticed that shipping from California to Massachusetts costs around 2,060 dollars for an electric car. But, we also observed that the same route costs only 1,604 dollars for a gasoline car.
On other routes, such as California to Virginia, the electric premium is 379 dollars.
For the Washington to Florida route, electric cars cost lower to ship at 1,429 dollars compared to gasoline cars at 1,841 dollars. We noted that this difference of 412 dollars proves that market demands matter more than weight.
| Shipping Corridor | Electric Avg Cost | Gasoline Avg Cost | EV Price Difference |
|---|---|---|---|
| CA to MA | $2,060 | $1,604 | +$456 |
| CA to VA | $1,960 | $1,581 | +$379 |
| CA to NY | $1,655 | $1,606 | +$49 |
| WA to FL | $1,429 | $1,841 | -$412 |
| CA to FL | $1,442 | $1,629 | -$187 |
Our route data analysis showed that location is the biggest factor. We noticed that some states have a higher demand for auto transport by fuel type. Our data showed that California sees a higher price for new electric models due to high volume. We concluded that shipping prices are a mix of distance, weight, and carrier availability and there is no fixed “battery tax” across the country today.
Carrier Type and Protection Preferences When Shipping EV vs Gas Cars
We observed that most people choose open carriers to save money. We saw around 86.4% electric cars on open racks; 90.88% gasoline car owners use open carriers too. Our data showed that 13.85% electric car owners chose enclosed shipping, while only 9.12% gasoline car owners preferred to move via enclosed shipping.
The electric vehicle shipping trends show a stronger focus on safety as owners want to keep their high-tech cars away from harmful elements, adding more to the shipping cost.
- Electric Enclosed Avg Cost: $1,693 (13.85% of EV moves)
- Gasoline Enclosed Avg Cost: $1,554 (9.12% of Gas moves)
- Electric Open Avg Cost: $1,123 (86.4% of EV moves)
- Gasoline Open Avg Cost: $1,152 (90.88% of Gas moves)
We observed that enclosed trailers are a luxury service for most shipped car types. Most electric car owners are willing to pay 123 dollars more than gas car owners for enclosed space as they paid around 1,693 dollars for the additional protection. Our data also showed that gas car owners prefer open carriers, sticking to the 1,152 dollar price. It shows that people value speed and low cost over protecting their gas cars.
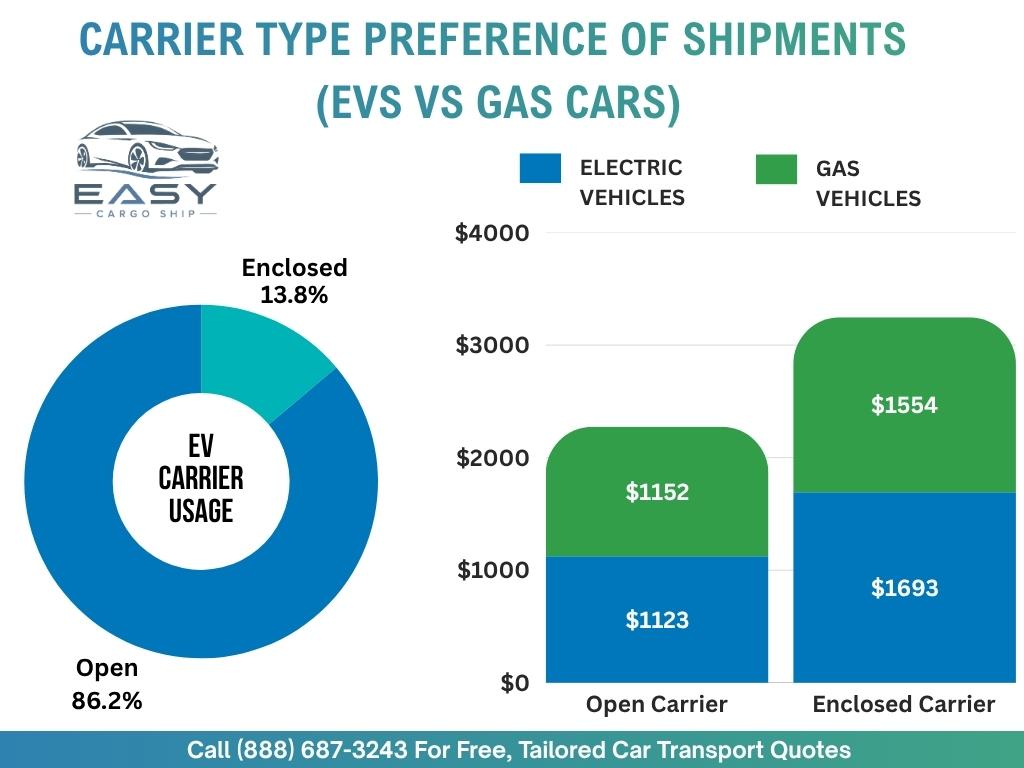
Our data showed that carrier type changes the shipping price and high value electric cars drive the premium market segment now.
Most Shipped Vehicle BodyTypes - Gas-Guzzlers vs Electric Cars
We observed that the type of vehicle affects shipping volume significantly. Our data from 2020 to 2025 car shipments pointed out that most people ship family cars and utility trucks, including Sedans and SUVs. We tracked many different body styles recently and each category shows a different fuel preference. Our data reveals how Americans like things to move, showing that trends vary by region and vehicle age.
Types of Trucks Shipped - EV vs Gas Powered
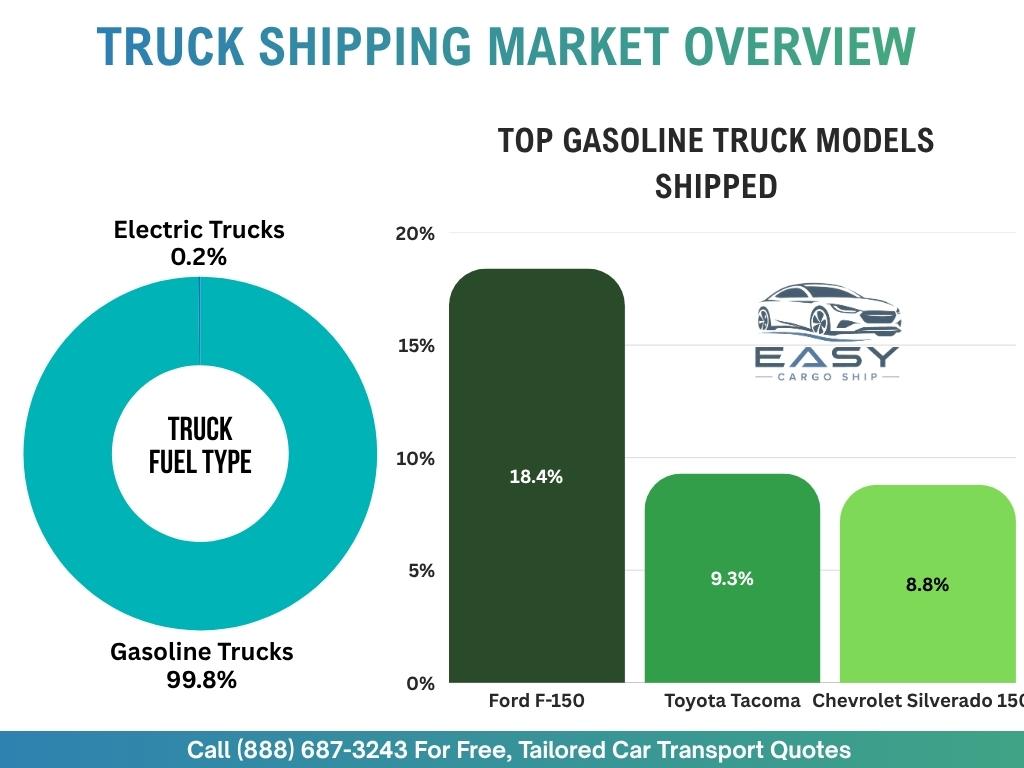
Our data highlighted how trucks are the solid part of the markets with 6.84% of total shipments. We noticed that 99.85% of truck shipments were of gasoline trucks, while only 0.15% were electrical trucks. This data highlighted the gasoline car shipping volume for pickups is huge, and most truck owners prefer traditional engines.
Ford F-150 takes the crown with 18.4% of total truck shipments followed by Toyota Tacoma and Chevrolet Silverado 1500 with 9.3% and 8.8% respectively of all trucks shipped.
Only 0.15% of electric trucks were shipped that mainly included Ford-150 Lightning and Rivian R1T.
Our data showed that traditional brands lead the shipping space, highlighting the slowness of the shift. People rely on gas engines for heavy hauling and electric trucks are a very rare sight.
SUV vs Sedan Regional Patterns
According to our data, we mostly shipped sedans and SUVs. Shipments involved around 15.39% of total Sedans and 13.2% of total SUVs. When we further dissected our data, we observed that there were 9% electric sedans and 6.4% electric SUVs.
Our data also helped us recognize regional patterns as the South moved 42% of all sedans and 40% of all SUVs. Whereas, the West shipped around 32% of all sedans and 32% of all SUVs. Electric vehicle shipping trends favor these body types as most city drivers choose sedans for transport and SUVs for families.
| Region | SUV Regional Share | Sedan Regional Share |
|---|---|---|
| South Region | 40.2% | 42.3% |
| West Region | 32.2% | 32.2% |
| Northeast Region | 15.5% | 14.0% |
| Midwest Region | 12.1% | 11.5% |
Our compilation of regional data also highlighted that people prefer sedans more. The South is the most active area, but the West also shows high volume. Auto transport by fuel type is visible here as more shipments were electric sedans as compared to SUVs. We also observed that buyers prioritize efficiency and cost.
Most Shipped EV vs Gas Car Types - Sports Cars and Vintage Market
Our data revealed a unique pattern regarding the performance cars and classics. Around 3.15% shipments were of sports cars, mostly powered by the gasoline engines. And, around 19.37% of the total shipments represent vintage vehicles, and 100% of these cars had a gasoline engine. Our data showed that these cars were at least 20 years old. Electric vs gasoline car shipping favors gas engines. Not only that, modern sports cars also lean heavily toward the gas engines.
We noticed that the collector market relies on older engines powered by gasoline. Corvette and Mustang are the most shipped names in the world of vintage cars. Electric tech is relatively new for collectors and even sports car owners prefer internal combustion. According to our data, high value specialty vehicles were shipped with care. Collectors market is very stable and traditional, keeping the classic car transport very busy.
Want to Move Your Vehicle? Easy Cargo Ship Can Help!
Whether you’ve got an electric car or a gas-powered vehicle, from sedans to trucks and luxury vehicles, we have a network of carriers to help you safely transport any automobile across the US. Call (888) 687-3243 to get your free, no-obligation EV or gas car transport quote now!